
 by
by How Accurate Are Star Maps? What the Stars Really Show
Last checked: 20 September 2026.
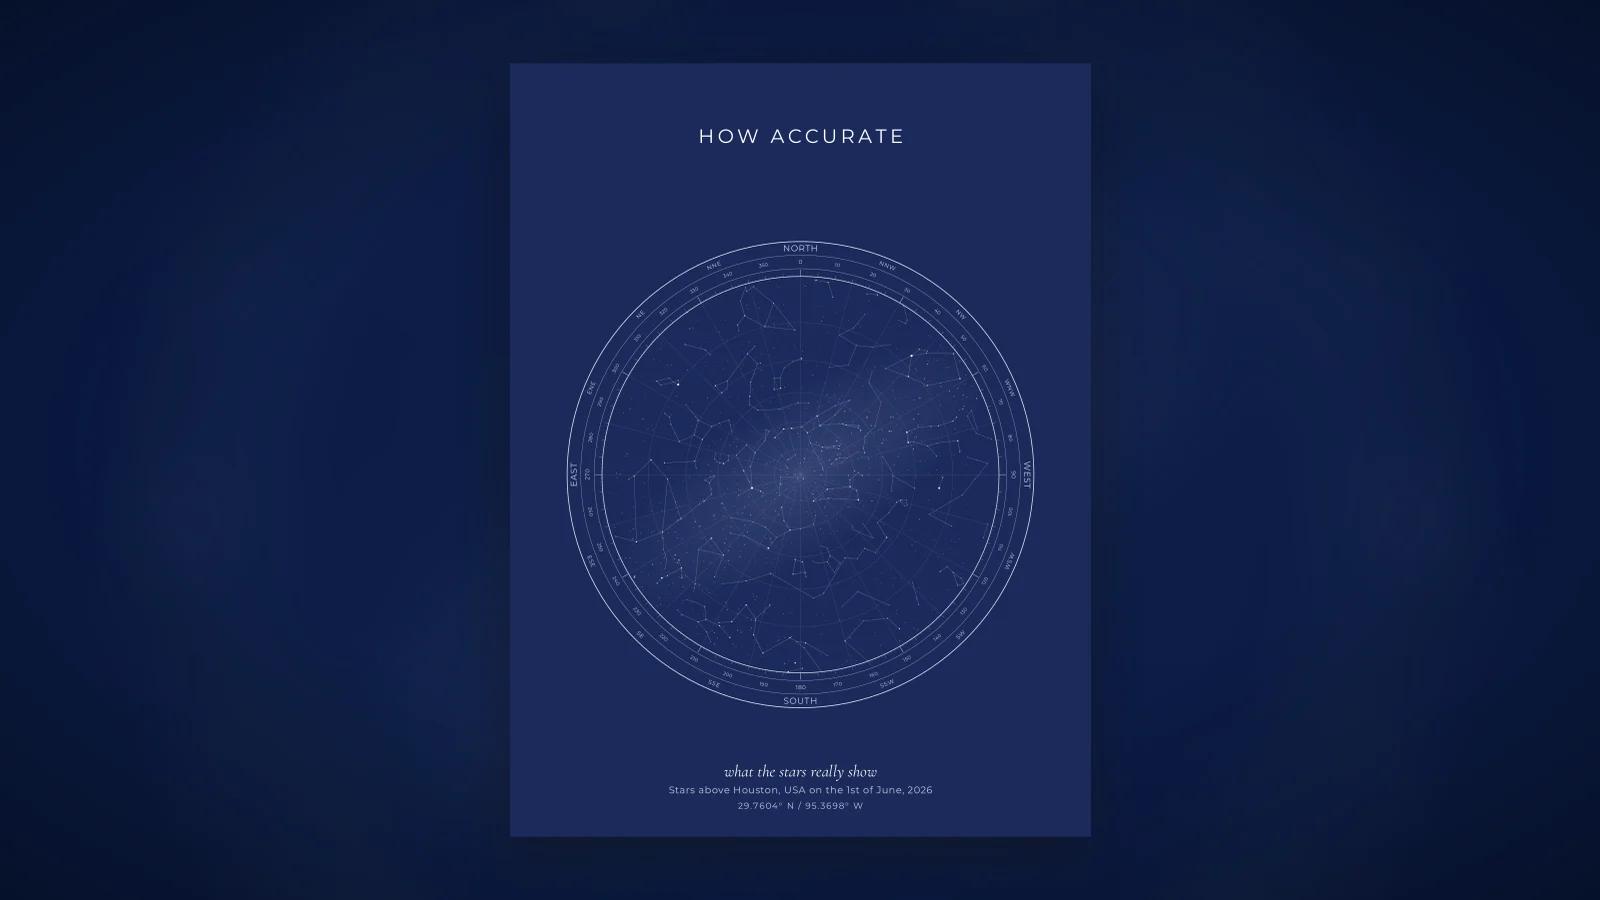
A custom star map claims something specific: that these stars, in these positions, were above this place at this moment. That claim is either true or it is not, and unlike most things sold as gifts, you can check it. This article explains what goes into an accurate map, where the honest limits are, what a star map does not show, and how to verify one yourself in about ten minutes with free software.
We make star maps, so we have a view. We have tried to keep this general enough to apply to any company's map, including a competitor's.
What a star map is computing
Every star map starts from the same four inputs: a date, a time, a latitude and a longitude. From those, the software has to answer one question for every star in its catalogue: was it above the horizon, and if so, where in the sky?
Stars are catalogued in celestial coordinates called right ascension and declination, which are fixed to the sky rather than to the Earth. To turn those into "how high, and in which direction" for an observer, the software needs to know how far the Earth has rotated at that instant. That quantity is local sidereal time, and it depends on the exact time and the observer's longitude. Latitude then determines how the celestial sphere tilts relative to the observer's horizon. Put together, each star's catalogue position converts to an altitude (height above the horizon) and an azimuth (compass direction). Stars with altitude above zero are drawn; the rest are not.
None of this is exotic. It is the same arithmetic that telescopes, planetarium software and navigation tables have used for a century. A company that does it correctly will produce the same sky as Stellarium for the same inputs. A company that does not will produce a pretty pattern that happens to be wrong.
The catalog: where the stars come from
The catalogue decides which stars exist on the map and how bright they are drawn. The ones used by reputable star map companies are all public:
- Hipparcos, the European Space Agency satellite catalogue of about 118,000 stars with precise positions and parallaxes.
- Yale Bright Star Catalog, the classic list of roughly 9,000 naked-eye stars with their traditional names and designations.
- HYG, an open compilation that merges Hipparcos, Yale and the Gliese nearby-star catalogue into one file (the name is the initials). Version 4.2, released in 2025, contains almost 120,000 stars and is published under a Creative Commons Attribution-ShareAlike licence.
We use HYG. So do GreaterSkies and OwnStarMap, by their own accuracy pages. The Night Sky names Hipparcos; Starrymaps names Yale. Any of these is a sound basis. The warning sign is a company that names no catalogue at all, because then you do not know whether the stars were computed or drawn.
Magnitude: how faint the map goes
A catalogue of 120,000 stars is far more than the eye can see. Apparent magnitude measures brightness on a scale where lower numbers are brighter: Sirius is about -1.5, the North Star about 2, and the faintest stars visible to a good unaided eye under a dark sky are about magnitude 6 to 6.5.
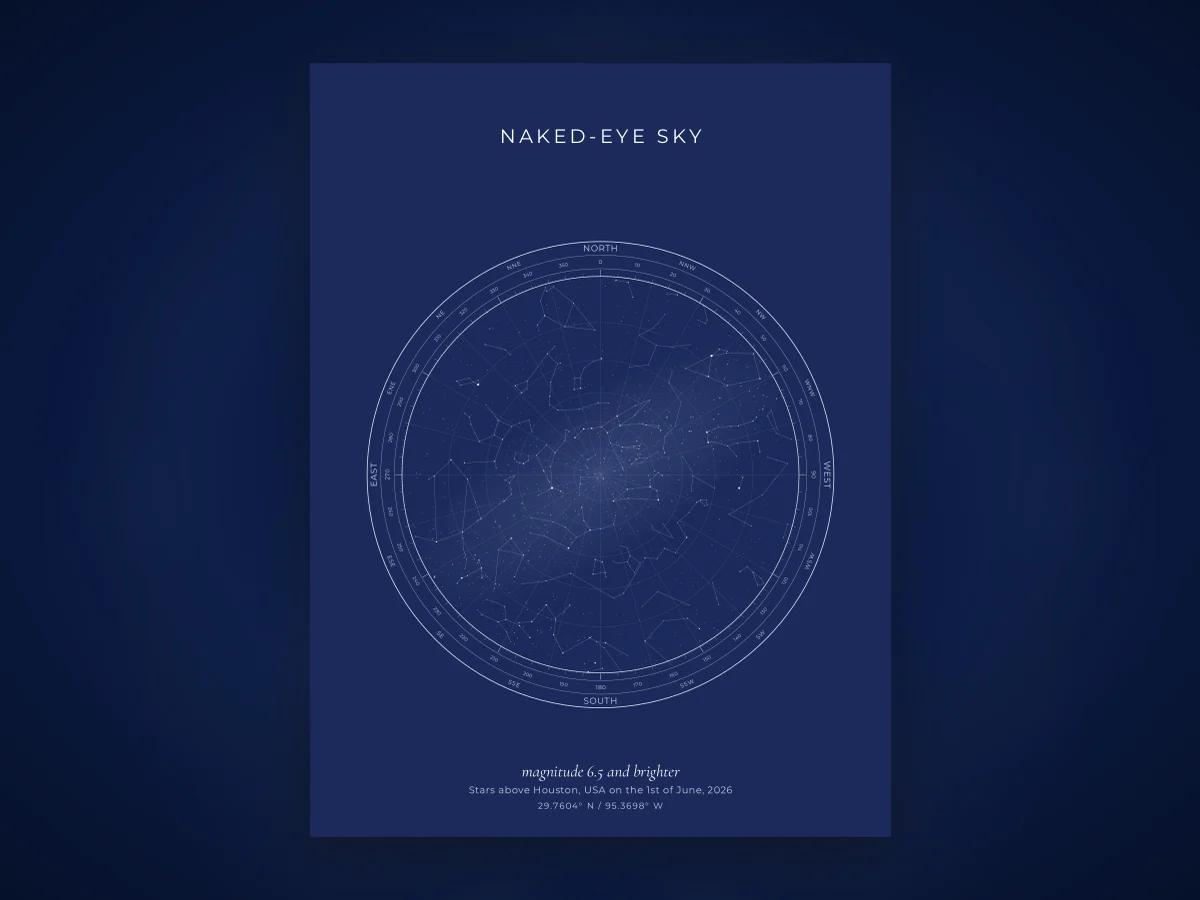
Most star map companies cut off around magnitude 6.5, which yields roughly 9,000 stars and matches naked-eye reality. Ours does: about 9,000 stars to magnitude 6.5. OwnStarMap states 8,921 stars at the same limit. GreaterSkies goes fainter, to magnitude 7, for 7,000 to 8,000 stars on a typical map (only the half of the sky above the horizon is drawn, which is why the on-map count is lower than the catalogue count).
Is fainter better? Not necessarily. Beyond magnitude 6.5 you are drawing stars that the person standing there could not have seen. It adds texture, and there is nothing wrong with it, but it is not more "accurate" in any way that matters for a memory. What does matter is that bright stars are drawn larger than faint ones, so that the familiar shapes (Orion's belt, the Plough, the Southern Cross) read at a glance.
Projection: flattening a dome onto paper
The sky is a hemisphere. Paper is flat. Something has to give, and the choice of projection decides what.
Almost every star map uses a stereographic projection centred on the zenith (the point directly overhead), with the horizon as the outer circle. It preserves angles and the shapes of constellations, which is why they look right. The cost is that scale grows toward the edge: a constellation near the horizon is drawn larger than the same constellation would be near the centre. This is not an error; it is a known property of the projection, and Stellarium's default view behaves the same way.
Two consequences follow. First, compass directions: on a map looking up, east and west are swapped relative to a ground map, because you are looking up through the dome rather than down onto it. A good map labels N, E, S, W on the horizon ring so there is no ambiguity. Second, the centre of the map is the most faithful part; stars near the rim were low in the sky and, in real life, often lost in haze or behind buildings.
Why the time matters as much as the date
The stars overhead change with the season, which everyone expects. They also change through the night, which is the part that trips people up. The Earth turns 15 degrees an hour, so the sky at 9 pm and the sky at 1 am on the same date are noticeably different. A map at midnight puts a different constellation on the meridian than a map at dusk.
That is why a star map asks for a time, and why the honest default is a specific one rather than "that night". If you do not know the exact time, pick the hour the moment happened and say so in the caption. A wedding first dance at 21:30 is a real instant; "sometime that evening" is not.
Why the time zone matters even more
This is the most common way star maps go wrong, including from companies that get the astronomy right.
The calculation needs Universal Time. The customer enters local time. The software has to convert one to the other, which means knowing the time zone of the place, on that date, including whether daylight saving was in force. Get it wrong by an hour and every star on the map is 15 degrees out of place, which is enough to move a constellation from one side of the meridian to the other.
Historical dates are harder still. Time zone boundaries and daylight-saving rules have changed many times in the past century; several US states and most European countries have different rules today than in 1950. Well-built software uses a historical time zone database (the IANA tz database is the standard) so that "9 pm in Houston in 1969" resolves to the right UTC instant. If a company's designer asks for a UTC offset rather than a place, or does not mention time zones anywhere, be cautious.
Precession and the 1900 to 2100 limit
Star positions in a catalogue are given for a reference epoch (J2000.0 is standard). Two slow effects move them away from those positions over time.
Precession is the wobble of the Earth's axis, a 26,000-year cycle that drifts the celestial coordinate grid by about 50 arcseconds a year. Over a decade it is invisible on a printed map. Over a century it amounts to more than a degree, roughly two full-moon widths, which is still small at poster scale but no longer nothing. Over a millennium the constellations rise and set at visibly different times and the pole star is a different star.
Proper motion is the actual movement of nearby stars through space. For most stars it is negligible over centuries. For a handful of close, fast stars (Barnard's Star, 61 Cygni, Arcturus to a lesser degree) it becomes measurable on a map over a hundred years or so.
Good software applies precession to the epoch you ask for, so a 1920 map is drawn in 1920 coordinates. But the corrections are approximations that degrade the further you go from the reference epoch, and the catalogue's proper motions are not complete. That is why GreaterSkies limits its maps to 1900 to 2100 and says so, and why we do the same. A company offering maps for the year 1066 or 3000 is either applying a very sophisticated model or, more likely, ignoring the problem. Ask which.
For any date a living person can have a memory of, none of this affects what you see. The limit exists so that we never sell a map we cannot stand behind.
What a star map does not show
This is the section most sales pages skip.
Planets. Venus, Jupiter, Mars and Saturn are often the brightest "stars" in the evening sky, and they are almost never on a custom star map, because they move against the stars and have to be computed separately. If your recipient remembers "that bright star next to the moon" from the night in question, it was very likely a planet, and it will not be on the map unless the company states that it plots planets. Our maps do not; our accuracy page says so.
The Moon. Same reason. A star map shows the sky as if the Moon were absent. Some companies offer a moon-phase graphic as a design element; that is a separate calculation and it is a phase, not a position.
Weather, twilight and light pollution. A star map shows every star above magnitude 6.5 above the horizon, regardless of whether the Sun was up, the sky was overcast, or the moment happened under city lights. A map for 3 pm on a summer afternoon is a real computation of the stars behind the daylight, but nobody saw them. That is worth knowing before you print a caption that says "the stars we saw."
The Milky Way, deep-sky objects, comets, satellites. Some maps draw a stylised Milky Way band; treat it as decoration unless the company says otherwise. Comets and satellites are never included.
None of this makes a star map inaccurate. It makes it a star map: a chart of the fixed stars, which is exactly what the name says.
How to verify a star map with Stellarium
Stellarium is a free, open-source planetarium used by amateur astronomers and in planetariums. It runs on Windows, macOS and Linux, and there is a browser version at stellarium-web.org that needs no installation. Checking a map takes about ten minutes.
- Open Stellarium Web (or the desktop app).
- Set the location. In the web version, click the location button at the bottom left and search for the city, or enter the latitude and longitude from the map.
- Set the date and time. Click the time display at the bottom right and enter the date and local time printed on the map. Stellarium handles the time zone for the location you set.
- Turn on constellation lines and, if you like, labels, using the toolbar at the bottom.
- Look straight up. Drag the view so that the zenith is in the middle, or switch to the full-sky view. Compare the brightest stars and the shapes of the constellations with the map. Remember the map may be rotated so that a particular direction is at the top; use the N/E/S/W marks on the horizon ring to align.
- Check two or three specific things: which constellation is highest, which bright star is nearest the horizon in the west, and whether a recognisable shape (the Plough, Orion, Cassiopeia) sits in the same part of the sky.
If those match, the map is accurate to any standard that matters for a print. If a constellation is on the wrong side of the sky, the time zone or the time is wrong. If the whole pattern is unfamiliar, the map may be decorative rather than computed. Our how it works page repeats these steps with screenshots.
A worked example: Apollo 11, 20 July 1969, Houston
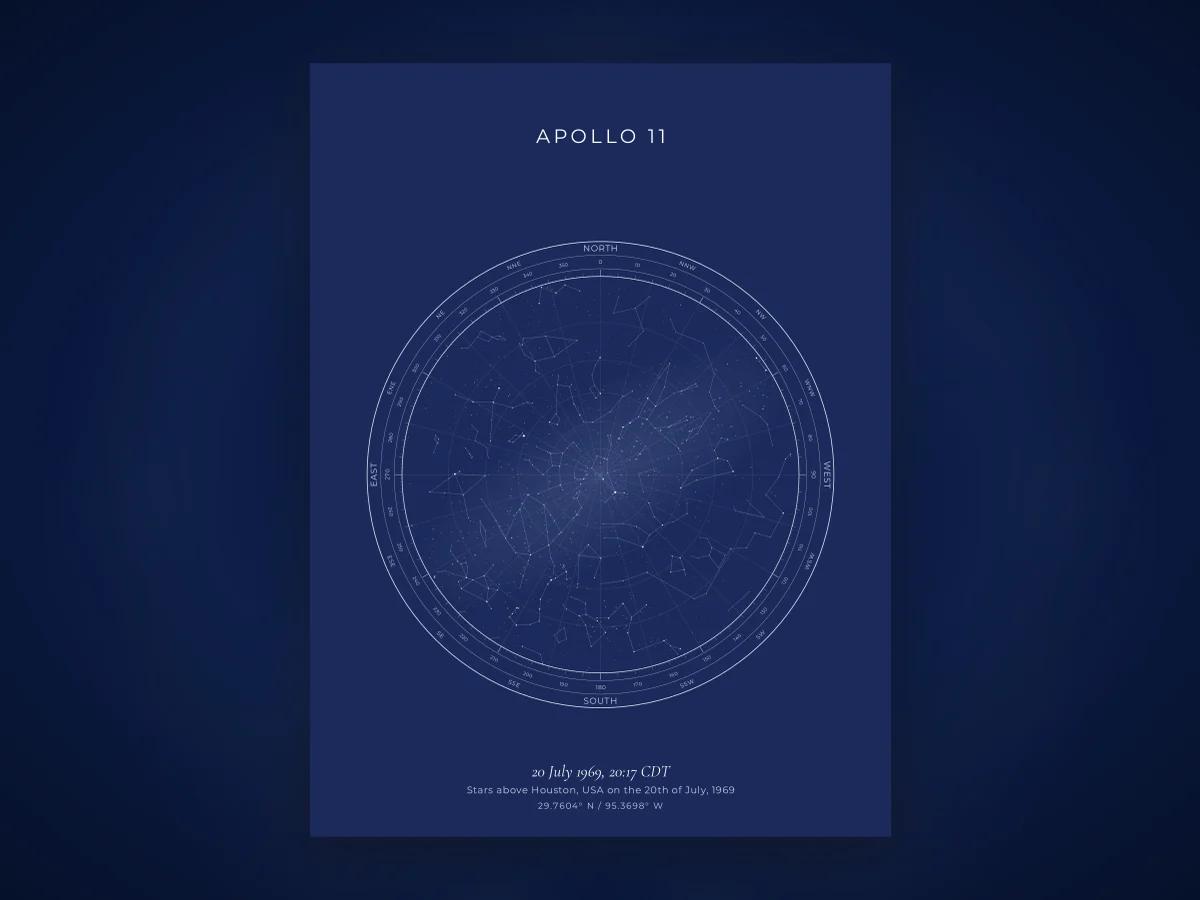
NASA's mission overview puts the lunar module Eagle's touchdown at about 102 hours 45 minutes after the 9:32 a.m. EDT launch on 16 July 1969, which works out to 4:17 p.m. EDT on 20 July, or 20:17 UTC. Mission Control was in Houston, Texas, on Central Daylight Time (UTC minus 5) that summer, so the landing happened at 15:17 local time: mid-afternoon.
That immediately illustrates one of the points above. A star map for the landing instant is a perfectly valid computation, and it shows the stars that were above Houston at that moment, but every one of them was hidden behind daylight. Nobody in Mission Control saw a single star. If you made this map, the caption should say "the sky above Houston at the moment of touchdown," not "the stars they saw."
Qualitatively, a Houston sky at that time of day and year has the Sun high in the south-west, and the star field around it is the spring-to-summer transition: the constellations that would have been overhead at midnight three months earlier. The winter groups, Orion among them, are below the horizon or lost near it. If you set this instant in Stellarium and remove the atmosphere, that is the pattern you will find; we are deliberately not quoting individual star altitudes here because the point of this article is that you should check them yourself rather than take a number from a page.
The more emotionally honest moment for a map is later that night. Neil Armstrong stepped onto the surface roughly 109 hours into the mission by NASA's timeline, around 10 pm on the evening of 20 July in Houston. By then the Sun was well down and a summer evening sky was out: Scorpius low in the south with red Antares, the Summer Triangle (Vega, Deneb, Altair) climbing in the east, Arcturus high in the west, and the Plough swinging down toward the north-western horizon. That is the ordinary shape of a July evening at 30 degrees north, and Stellarium will confirm it in a minute.
Two further honesty notes. The Moon was a young waxing crescent that week and would have been low in the west after sunset; a star map does not show it, though it is the one object everyone in Houston was thinking about. And the map is for Houston, not for the Sea of Tranquility. A star map of the sky as seen from the Moon is a different calculation, and no consumer star map company, including us, makes one.
What "accurate" should mean when you buy
A star map is accurate if, for the place, date and time printed on it, its bright stars and constellations match what Stellarium shows for the same inputs. That is a lower bar than professional astrometry and a higher bar than most décor. Companies that clear it will tell you their catalogue, their magnitude cut-off, their date range and what they leave out. Those that do not may still be fine, but you cannot know without doing the check yourself.
You can design a map here in any of our twelve designs and run it through the Stellarium steps above before paying anything; the on-screen preview is the finished map, and the free downloadable version carries a small watermark. The pricing page has the rest, and the anniversary page is a common place to start.
Sources
- HYG database (astronexus.com), versions, sources, licence: https://www.astronexus.com/hyg
- Stellarium: https://stellarium.org/ and https://stellarium-web.org/
- IAU, "The Constellations" (88 official constellations, boundaries adopted 1928): https://iauarchive.eso.org/public/themes/constellations/
- GreaterSkies accuracy statements (catalogues, magnitude 7, 1900 to 2100 and precession): https://www.greaterskies.com/ and https://greaterskies.com/custom-star-map/
- OwnStarMap technical statement (HYG v4.2, 8,921 stars, magnitude 6.5): https://ownstarmap.fr/en/
- The Night Sky accuracy page (Hipparcos): https://www.thenightsky.com/accuracy-of-our-star-maps
- Starrymaps accuracy page (Yale Bright Star Catalog): https://starrymaps.com/accuracy-of-our-star-maps/
- The Star Moment accuracy: https://thestarmoment.com/accuracy
- NASA, Apollo 11 Mission Overview (launch 9:32 a.m. EDT 16 July 1969; landing at about 102 h 45 min; first step at about 109 h): https://www.nasa.gov/history/apollo-11-mission-overview/
Frequently asked questions
Are custom star maps scientifically accurate?
The good ones are, to the standard described here: the positions of stars to naked-eye magnitude, computed for the stated place and time from a public catalogue. They are not observatory-grade charts, and they omit planets and the Moon.
Why does my star map look different from my friend's for the same date?
Different time, different place, or different time zone handling. An hour's difference moves the whole sky by 15 degrees. Compare the printed times and locations first.
Does the time of day really matter?
Yes. The stars overhead at 8 pm and 2 am on the same night are substantially different. If you do not know the exact time, choose the hour the moment happened and say so.
Can I get a star map for a date before 1900 or after 2100?
Some companies will sell one. We and GreaterSkies decline, because precession and proper motion corrections become less reliable that far from the catalogue epoch. For any date within living memory, it is not a concern.
Does a star map show the planets or the Moon?
Almost never, and never unless the company explicitly says so. Both move against the stars and require a separate calculation. If your memory of the night includes a very bright "star," it was probably a planet.